Monday, April 9, 2007
Saturday, February 10, 2007
Solution Part 3
Queen Hopra chases Pedro and Kuro for five seconds. The two pandas' velocity is given by 3t^3cos(t) metres per second. What is the total distance that the pandas travelled? Did they get to the ship safely?
What is the total distance that pandas travelled?
There are TWO ways to solve this problem. You can do it with paper and pencil OR you can use your bestfriend, the calculator!
METHOD 1:

NOTE: You have to find the absolute value of your answer. Therefore, Pedro and Kuro travelled 196.5753 metres.
METHOD 2:

Did they make it to the ship safely?
No they didn't. Your answer had a -ve sign which means they're farther away from the ship than when they started! Thanks to Kuro Kuro, Pedro couldn't see where he was going so he was running AWAY from their new bamboo ship. What will happen next? T__T
Wednesday, December 20, 2006
Part 2 solutions

To find the distance we would use the pythagorean theorem and solve for z. x= 10(Pedro's distance) and y = 15(queen's distance).
x2 + y2 = z2
102 + 152 = z2
To find the rate of change of z we have to differentiate x2 + y2 = z2.
x(dx/dt) + y(dy/dt) = z(dz/dt)
before we plug in our given values we have to convert the units. I decided to convert m/s to km/hr.
(1.38m/s)(3.6) = 5 km/hr
(2.22m/s)(3.6) = 8 km/hr
Now we can plug in the values.
x(dx/dt) + y(dy/dt) = z(dz/dt)
(10)(5) + (15)(8) =
170 /
dz/dt = 9.4299 km/hr
If you convert that to m/s you can divide the answer by 3.6
9.4299 / 3.6 = 2.62 m/s
Thursday, November 30, 2006
Pedro Project Part 1 Solution
Hey guys! The problem I came up with is a review of the relationships between parent functions, first derivative functions and second derivative functions. I highly recommend that you keep the story page open in another tab/window so that you can refer to the graphs all the time. In this post, I will:
(1) Identify the parent graph, first derivative graph and second derivative graph.
(2) Eliminate the three irrelevant graphs.
(3) Confirm/justify the answers.
Remember when we first did one of those group in-class assignments? It was about Willy the Wallaby, I think. Mr. K said that it's good to have the answers, but it's just a minimal part of the education process. It's how we got to our answers that matter. SO, here's the solution =)
Solution:
Well to start with, we could look at the details of the story and find anything that stands out. For me, it's when the donkey exploded. When this incident occured, Pedro immediately came to a halt, and his velocity dropped to zero. We've dealt with graphs before where, at the end, they gradually plateau (e.g. figure 1), but for this problem, it shouldn't.  Pedro and the donkey didn't slow down then screeched to a halt; the donkey just went boom in the middle of its gallop! So, graphs A, B, D or F can't be the position-time graph. This leaves C and E. Well, if you take a look at E, it's decreasing throughout. We know that Pedro starts the journey off by going in the positive direction, goes back, and dashes away on a positive position again, so E can't be it. Therefore, C is the position-time graph.
Pedro and the donkey didn't slow down then screeched to a halt; the donkey just went boom in the middle of its gallop! So, graphs A, B, D or F can't be the position-time graph. This leaves C and E. Well, if you take a look at E, it's decreasing throughout. We know that Pedro starts the journey off by going in the positive direction, goes back, and dashes away on a positive position again, so E can't be it. Therefore, C is the position-time graph..
It's been said that Pedro just abruptly stops, right? That means that his velocity just dropped to zero, and A, B, C or E can't be the velocity-time graph. Well, if you take a look at graph D, at the end of it is a removable discontinuity. The output just suddenly became zero, and that's promising. If you take a look at graph F, it appears to just drop to zero, but if it is a vertical line, then it wouldn't even be a function. So, graph F isn't the velocity-time graph, but D.
.
Now comes the actual calculus solutions. So far, we've been able to determine the parent and first derivative graphs simply through common sense. Well, we'll get to the core of derivatives shortly.
.
We learned that a derivative is rate of change, or the slope of a tangent line on a given graph. If we don't, don't, don't forget that a derivative is a slope, then we should be fine.
.
Let's confirm our answers above first (f is graph C, f' is graph D). Well, at the minimum or maximum of C, there should be a root on D, right? If you take a look at the graphs, this is indeed the case. Also, Where C is decreasing, D should be below the x-axis, and where C is increasing, D should be above the x-axis, and that is true for the graphs.
.
When it comes to the second-derivative graph, we can first observe the slopes of D. Where there are minima or maxima in D, there should be a root in f", right? Well, which among A,B,E and F fit this? Seems like only F fits this. Assuming that F is the second derivative graph, wherever it has a root, there should be a point of inflection on C. Wherever C is concave up, F must be below the x-axis, and wherever C is concave down, F must be below the x-axis. If we check, we'll see that what I've described does occur for the two graphs. Therefore, F is the acceleration-time graph.
.
That's it for me! Please make suggestions on how to improve either the solutions or my part of the story. While I was solving the question, it almost seemed too easy. I hope you guys found it more challenging.
Using The Rubic: Assessment As Learning
OK, we've settled on the rubric and, after a lengthy discussion, decided to keep it the way it is. In todays class we also decided that this is how we would use it:
(1) After a student posts a problem and solution every other student in the class will assess their work using the rubric. You will post your assessment on this blog in the comments to the relevant post. Use this template to record your results, 1-4 in each category:
You should include constructive comments suggesting how the student can improve the work and move it up within each category they scored less than 4. This assessment should be done within two days of the problem being posted to the blog.
(2) The student who posted the problem has one week to make edits and improve their work. The goal is to get 100%. (More with the bonus. ;-))
(3) I will also assess the student's work, however the result of my assessment will be shared with the student privately.
The purpose of assessing your work this way is to encourage each other to do better work and achieve the greatest success possible. Don't let each other down ... get your comments in within two days of each problem being posted to the blog. Remember: What we can accomplish together is far greater than anything we can do by ourselves.
If you like you can click on the image below to see the rubric at a glance. Feel free to print it out if you like.

(1) After a student posts a problem and solution every other student in the class will assess their work using the rubric. You will post your assessment on this blog in the comments to the relevant post. Use this template to record your results, 1-4 in each category:
Concepts:
Terminology/Notation:
Challenge:
Solution:
Creativity:
Humour/Drama bonus:
You should include constructive comments suggesting how the student can improve the work and move it up within each category they scored less than 4. This assessment should be done within two days of the problem being posted to the blog.
(2) The student who posted the problem has one week to make edits and improve their work. The goal is to get 100%. (More with the bonus. ;-))
(3) I will also assess the student's work, however the result of my assessment will be shared with the student privately.
The purpose of assessing your work this way is to encourage each other to do better work and achieve the greatest success possible. Don't let each other down ... get your comments in within two days of each problem being posted to the blog. Remember: What we can accomplish together is far greater than anything we can do by ourselves.
If you like you can click on the image below to see the rubric at a glance. Feel free to print it out if you like.
Monday, November 13, 2006
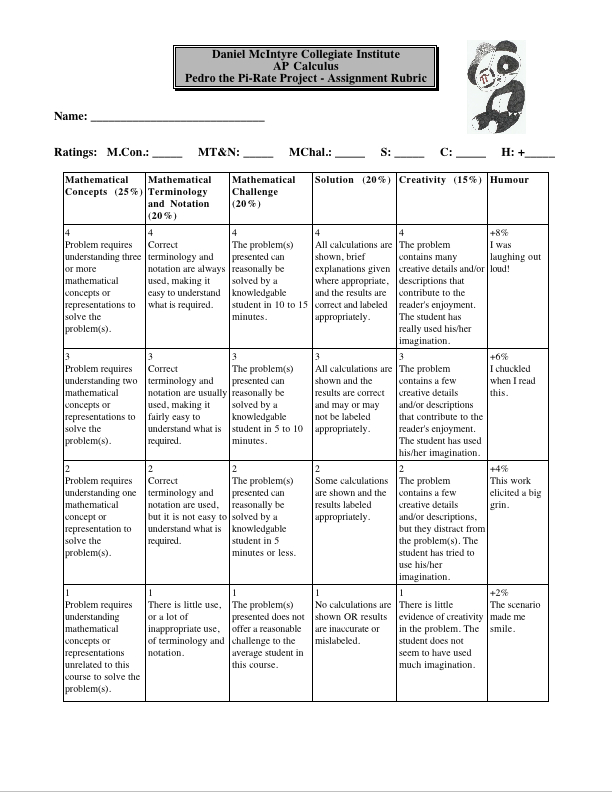
The Grading Rubric
These are the criteria by which your work will be assessed. Please share your thoughts regarding if and how we should change this rubric in the comments below this post. This instrument can be made better only if you participate in its development -- it's your mark on the line; it's up to you ...
Creativity (25%)
4
The problem contains many creative details and/or descriptions that contribute to the reader's enjoyment. The student has really used his/her imagination.
3
The problem contains a few creative details and/or descriptions that contribute to the reader's enjoyment. The student has used his/her imagination.
2
The problem contains a few creative details and/or descriptions, but they distract from the problem(s). The student has tried to use his/her imagination.
1
There is little evidence of creativity in the problem. The student does not seem to have used much imagination.
Mathematical Concepts (30%)
4
Problem requires understanding three or more mathematical concepts or representations to solve the problem(s).
3
Problem requires understanding two mathematical concepts or representations to solve the problem(s).
2
Problem requires understanding one mathematical concept or representation to solve the problem(s).
1
Problem requires understanding mathematical concepts or representations unrelated to this course to solve the problem(s).
Mathematical Terminology and Notation (20%)
4
Correct terminology and notation are always used, making it easy to understand what is required.
3
Correct terminology and notation are usually used, making it fairly easy to understand what is required.
2
Correct terminology and notation are used, but it is not easy to understand what is required.
1
There is little use, or a lot of inappropriate use, of terminology and notation.
Mathematical Challenge (25%)
4
The problem(s) presented can reasonally be solved by a knowledgable student in 10 to 15 minutes.
3
The problem(s) presented can reasonally be solved by a knowledgable student in 5 to 10 minutes.
2
The problem(s) presented can reasonally be solved by a knowledgable student in 5 minutes or less.
1
The problem(s) presented does not offer a reasonable challenge to the average student in this course.
Solution (20%)
4
All calculations are shown, brief explanations given where appropriate, and the results are correct and labeled appropriately.
3
All calculations are shown and the results are correct and may or may not be labeled appropriately.
2
Some calculations are shown and the results labeled appropriately.
1
No calculations are shown OR results are inaccurate or mislabeled.
Bonus Marks! - Humour or Drama
+0%
No humour or drama used in the problem presentation.
+2%
The scenario made me smile.
+4%
This work elicited a big grin/a sense of suspence.
+6%
I chuckled/was very moved when I read this.
+8%
I was laughing/crying out loud!
Subscribe to:
Posts (Atom)